

Is Long Beach, CA Safe? Crime Data and Quality of Life in 2026
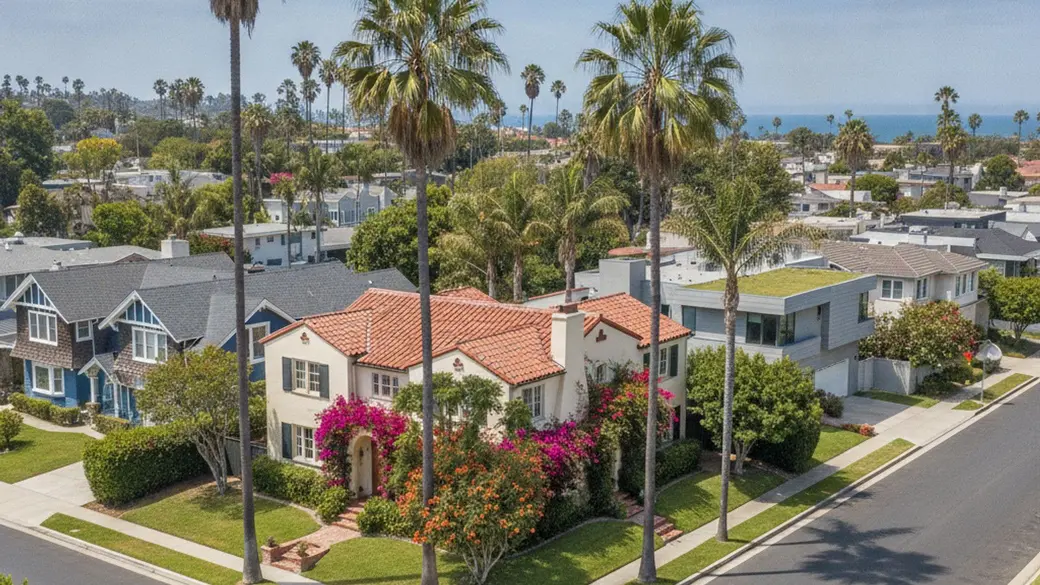
The median home price in Long Beach, CA sits around $852,500 as of mid-2026, and there are approximately 740 homes on the market right now. Buyers frequently weigh the pros and cons of living in Long Beach before making an offer. Almost every buyer I talk to eventually asks the same question: how safe is it? For a city this size, that's not a simple answer - it requires looking at actual crime numbers, environmental factors, and what day-to-day life here looks like on the ground.
Long Beach is a major coastal city in Los Angeles County with a population of 444,232, according to the 2024 FBI crime data reporting period. A city this large doesn't have one story. It has dozens of them, and the honest way to evaluate safety is through the data and recent trends, not reputation.
Crime Rates and Recent Trends in Long Beach
Long Beach's overall crime rate is approximately 4,155.3 incidents per 100,000 residents, based on 2024 FBI data. That puts the city's total crime rate about 96% higher than the national average. HomeSnacks reports these town-level aggregates, which reflect the entirety of the city's jurisdictions.
That number sounds stark, but context matters. Long Beach spans a large geographic footprint - dense commercial corridors, industrial zones, and residential streets all roll into the same citywide figure. Before you read too much into a single statistic, it's worth understanding what's actually driving it.
Violent and Property Crime Statistics
The violent crime rate in Long Beach is 676.4 per 100,000 residents, roughly 88% higher than the national average.
Property crime carries the heavier statistical weight. The city's property crime rate is 3,478.8 per 100,000 residents - about 97.7% above the national average - and that figure covers burglary, larceny, and motor vehicle theft. If you're budgeting for a home here, that number has real practical implications for things like insurance and home security.
How Crime Has Trended Recently
Over the past five years, Long Beach generally saw rising violent and property crime rates. The 2024 crime rate increased 13% from 2023, with overall crime up roughly 22.7% year-over-year during that FBI reporting period, according to City-Data.
What's happened since then is worth knowing. Preliminary data from 2025 shows the trend reversing: during the first half of 2025, murders dropped by nearly 28% and property crime decreased by 23.6% compared to the same period in 2024. One year of preliminary data isn't a verdict, but it's a meaningful shift.
Public Safety and Emergency Services
The Long Beach Police Department and the Long Beach Fire Department handle primary emergency coverage for the city. Between them, they manage 911 dispatch, patrol operations, fire suppression, and emergency medical services across the city's various districts.
If you're coming from a smaller town, the difference in scale here matters. In a city of over 440,000 people, response times and patrol frequency depend on daily call volumes and how resources are allocated across the city at any given moment. The most direct way to understand service levels in a specific area is to contact the police department's non-emergency line or pull from their public data portals - don't rely on secondhand accounts.
Police and Fire Coverage
The police department divides the city into patrol divisions to manage both emergency response and community policing. Fire and EMS coverage runs through a network of stations distributed across the city, built to reach medical emergencies and structural fires throughout Long Beach's footprint.
Know where your nearest fire station and police precinct are. The department also runs specialized divisions for traffic enforcement, marine patrols along the coast, and targeted emergency response units.
Reporting and Response Procedures
For any immediate threat to life or property, 911 is your call. The city also maintains non-emergency dispatch numbers for noise complaints, minor property crimes with no suspect present, and general questions.
For documentation - especially for insurance claims on minor property incidents - the city's online reporting systems handle a lot of that efficiently.
Environmental Hazards and City Beach Water Quality
Crime statistics are only part of the safety picture in a coastal city. Long Beach's geography puts it up against the Pacific Ocean, active fault lines, and Southern California's particular weather patterns. These factors belong in your due diligence just as much as the crime data does.
Check state and local databases for property-specific risks before you're deep into escrow. Finding out about a flood zone designation after you've made an offer is the kind of surprise you don't want.
Swim Status at Long Beach City Beach
Long Beach City Beach is a genuine draw for residents, but water quality isn't consistent year-round. The local health department and state environmental agencies monitor bacterial levels regularly, and conditions can shift quickly after rainfall and urban runoff events.
Check current advisories before going in the water - particularly in winter and early spring, when storm runoff hits the immediate coastline hardest.
Natural Hazards to Consider
Earthquakes, potential flooding in low-lying areas, and severe weather are part of life across much of Southern California, and Long Beach is no exception. Pull the local flood zone maps for any property you're seriously considering - mandatory flood insurance is a real cost that affects your monthly payment.
Wildfire risk and wildlife interactions also vary depending on how close a property sits to open spaces and brush areas. The state environmental agency has hazard mapping tools that will show you exactly what risks attach to a specific address.
What Living in Long Beach Is Like
The statistics frame the city, but they don't tell you what it actually feels like to live here. Long Beach has coastal access, a working local economy, and a real housing market - not a sleepy suburb and not just a bedroom community for LA.
The market reflects that. In May 2026, 194 homes sold in the city, with the average property spending roughly 41 days on the market. About 44% of homes sold above their list price, and the average sale-to-list ratio sat right at 100%. You're not looking at a slow market.
Recreation and Commuting
Biking paths along the shoreline, municipal golf courses, public parks, farmers markets, waterfront events - there's a consistent rhythm to outdoor life here that a lot of buyers genuinely value. The coast isn't just scenery; it's part of how people spend their weekends.
For commuters, the I-405 and I-710 are the main arteries into the broader Los Angeles and Orange County areas. The Metro A Line connects downtown Long Beach directly to Los Angeles for those who'd rather skip the freeway altogether.
Housing Costs and Market Activity
At a median sale price of approximately $852,500, housing costs here require honest budgeting. The city currently holds about 3.8 months of housing supply - enough to give buyers some options, but still a market that favors sellers in a lot of transactions.
Factor in local property tax rates and school enrollment processes as part of your total cost picture. Those details add up, and dedicated resources on local cost of living and school districts will give you a fuller breakdown.
Comparing Long Beach to State and National Averages
Benchmarking Long Beach against broader geographies puts the numbers in better perspective. The citywide rates are higher than the national baseline, but seeing where Long Beach falls relative to California as a whole is part of understanding what you're actually looking at.
These comparisons draw from 2024 aggregate data to keep things consistent across reporting agencies. CrimeByCity and similar platforms compile these figures to show how major municipalities measure up.
The California Average
California's total crime rate in 2024 was about 2,679.3 per 100,000 residents, breaking down into a violent crime rate of 518.0 per 100,000 and a property crime rate of 2,161.3 per 100,000.
Long Beach's overall rate of 4,155.3 per 100,000 sits noticeably above that state average. Both the violent and property crime rates exceed the statewide baselines for the same reporting period.
The National Average
California's overall crime rate tracks closely with the national average - which means Long Beach, sitting above the state figure, also sits well above the national one. Specifically, Long Beach's overall crime rate is approximately 96% higher than the national average, with a violent crime rate about 88% higher and a property crime rate roughly 97.7% above the nationwide figures.
Frequently Asked Questions
What are the safest neighborhoods to buy a home in Long Beach, CA?
Safety data is reported at the citywide level, with Long Beach experiencing an overall crime rate of about 4,155.3 per 100,000 residents. For specific addresses, review municipal police reports rather than neighborhood safety rankings. Under Fair Housing guidelines, real estate professionals don't steer buyers toward or away from specific neighborhoods based on safety claims.
How does safety in East Long Beach compare to Downtown or North Long Beach?
Crime statistics are tracked for Long Beach as a whole, which recorded a property crime rate of 3,478.8 per 100,000 residents in 2024. If you want to compare specific areas, the Long Beach Police Department's public data portals are your best resource for localized incident reports. Broad comparisons between East Long Beach, Downtown, and North Long Beach tend to lean on subjective opinion more than objective city data.
How can I check neighborhood crime rates before putting an offer on a Long Beach house?
Start with the Long Beach Police Department's public crime mapping tools and request address-specific reports. The city's 2024 baseline of 676.4 violent crimes and 3,478.8 property crimes per 100,000 residents gives you a reference point. Cross-referencing that with official city dispatch data gives you the most accurate read on a specific street.
Are property crimes like package theft and break-ins a major issue for Long Beach homeowners?
Property crime makes up the largest share of the city's total crime rate. In 2024, Long Beach reported a property crime rate of 3,478.8 per 100,000 residents - about 97.7% higher than the national average. That said, preliminary data for the first half of 2025 showed a 23.6% decrease in property crime compared to the same period the year before.
Will buying a house in certain Long Beach zip codes increase my homeowner's insurance rates due to crime?
It depends on how the carrier assesses the specific address. The citywide property crime rate is roughly 97.7% above the national average, but insurers also weigh environmental risks like flood zones and wildfire proximity. Get insurance quotes for specific properties early in the escrow period - don't wait until you're close to closing.
What should sellers do to address safety concerns when listing a home in a transitional Long Beach neighborhood?
Stick to what's factual and property-specific: updated security systems, exterior lighting, reinforced doors. The median home price in Long Beach is approximately $852,500, and homes spend a median of 41 days on the market - there's real buyer demand across the city. Making subjective claims about the surrounding area doesn't help your listing and creates problems. What's in the four walls is what you can speak to directly.
Categories
- All Blogs (282)
- Aliso Viejo, California (2)
- Anaheim, Calfornia (5)
- Beach House (2)
- Best places for surfers (1)
- Bixby Knolls (1)
- Buena Park, California (2)
- Buying and Selling Real Estate (75)
- Buying or Seller Real Estate (2)
- California (2)
- California Beach House (2)
- Cerritos, California (1)
- Costa Mesa, California (1)
- Current Market (5)
- Cypress, CA (5)
- Dana Point, California (1)
- Downey, California (1)
- Equestrian (1)
- Fountain Valley, California (5)
- FSBO (1)
- Fullerton, California (1)
- Fur Parents (1)
- Garden Grove California (6)
- History (4)
- Holiday in Long Beach (1)
- home (12)
- Home Improvement (1)
- home value (7)
- Huntington Beach (5)
- Irvine, California (3)
- La Habra, California (1)
- Laguna Niguel, California (1)
- Lake Forest, California (1)
- Lakewood Event (2)
- Lakewood, California (46)
- Lifestyle (3)
- Listing (1)
- Long Beach Events (1)
- Long Beach Neighborhood (7)
- Long Beach, California (77)
- Los Alamitos (1)
- Los Alamitos, California (2)
- Market Reports (8)
- Mission Viejo, California (1)
- Mortgage Lender (1)
- Moving to Aliso Viejo, California (2)
- Moving to Anaheim, California (4)
- Moving to Buena Park, California (2)
- Moving to California (11)
- Moving to Cerritos, California (1)
- Moving to Costa Mesa, California (1)
- Moving to Cypress, CA (4)
- Moving to Dana Point, California (1)
- Moving to Downey, California (1)
- Moving to Fountain Valley, California (4)
- Moving to Fullterton, California (1)
- Moving to Garden Grove, California (5)
- Moving to Huntington Beach (5)
- Moving to Irvine, California (3)
- Moving to Lakewood (4)
- Moving to Lakewood, California (7)
- moving to Long Beach, California (17)
- Moving to Los Alamitos, California (2)
- Moving to Los Angeles (1)
- Moving to Mission Viejo, California (1)
- Moving to Newport, California (3)
- Moving to Orange County, California (20)
- Moving to Orange, California (2)
- Moving to Placentia, California (1)
- Moving to Rossmoor, California (1)
- Moving to San Clemente, California (2)
- Moving to Seal Beach, California (4)
- Moving to Signal Hill, California (2)
- Moving to Stanton, California (1)
- Moving to Tustin, California (2)
- Moving to Westminster, California (3)
- New Developments (1)
- Newport Beach, California (3)
- Orange County, California (10)
- Orange, California (3)
- Placentia, California (1)
- Real Estate (47)
- Real Estate Agent (28)
- Rossmoor, California (1)
- San Clemente, California (2)
- San Juan Capistrano, California (1)
- Saving Money (1)
- Seal Beach, California (6)
- Signal Hill, California (5)
- Social Media (1)
- Stagnation (1)
- Stanton, California (1)
- Success Story (1)
- surfing (1)
- Tips in Moving (2)
- Tustin, California (3)
- Westminster, California (3)
Recent Posts
GET MORE INFORMATION